Vanderbilt Had a 0.1% Chance. Then Football Stopped Making Sense.
Six seconds. NC State leading 31–28. Possession of the football. A 99.9% win probability. Vanderbilt somehow turned that situation into a 35–31 victory and one of the strangest graphs the sport will produce all season.
For almost the entire afternoon of September 19, Vanderbilt was losing to NC State. The Commodores fell behind 14–0, later faced a 17-point deficit and still trailed 24–7 midway through the third quarter. By the final minute, they had fought back to 31–28 — only for Jared Curtis to throw an interception near the NC State goal line.
That should have finished it. The Wolfpack had the lead, the football and almost no time left to survive. Vanderbilt Athletics would later note that the Commodores led this game for exactly one second. The astonishing part is that the one second was the only one that mattered.
With six seconds remaining, ESPN’s probability model had NC State at 99.9 percent. Vanderbilt occupied the leftover decimal point: 0.1. In most games, that number is not hope. It is the model politely refusing to print zero.
The Play That Was Supposed to End the Game
NC State faced fourth-and-seven from its own five-yard line. The plan was to consume the remaining time while quarterback CJ Bailey retreated into the end zone, then concede an intentional safety if necessary. Even two points for Vanderbilt would leave the Wolfpack ahead.
Instead, Bailey stayed alive long enough for Vanderbilt edge defender Miles Capers to reach him. Before Bailey could finish the play safely, Capers punched the football loose. Cornerback Cayden Daniels fell on it in the end zone.
Touchdown Vanderbilt.
The probability model did not slowly change its mind. It went from virtually certain defeat to Vanderbilt leading the football game in one broken play.
Replay left one second on the clock. Vanderbilt kicked the extra point, NC State attempted one last desperate sequence and the final became 35–31. The Commodores had completed a 17-point comeback — the largest of Clark Lea’s tenure and Vanderbilt’s biggest comeback from that margin since 2012.

Why 0.1% Became the Perfect Fan Language
Sports fans remember certain games through scores. Others survive through one photograph or one announcer call. Vanderbilt–NC State has a number that can tell the entire story by itself.
“0.1%” contains the absurdity before anyone explains the play. It tells a viewer that the game was effectively over, that the comeback had already run out of normal pathways and that what happened afterward belonged to the statistical edge case rather than conventional football strategy.
The first design leans completely into that compression. Oversized gold 0.1% typography owns the chest, while “A New Miracle,” the 35–31 score and 9/19/26 turn the graphic into a date-stamped artifact. It does not need to draw the fumble. The percentage is the fumble.
The Graph May Be Even Stranger Than the Number
The second design takes a wider view. A win-probability line tracks the afternoon rather than isolating the final six seconds, allowing the viewer to see Vanderbilt living below NC State for almost the entire game before the chart breaks vertically at the end.
A normal win-probability chart explains momentum. This one becomes the visual joke: the game spends four quarters telling one story, then uses its final second to invalidate the entire shape.
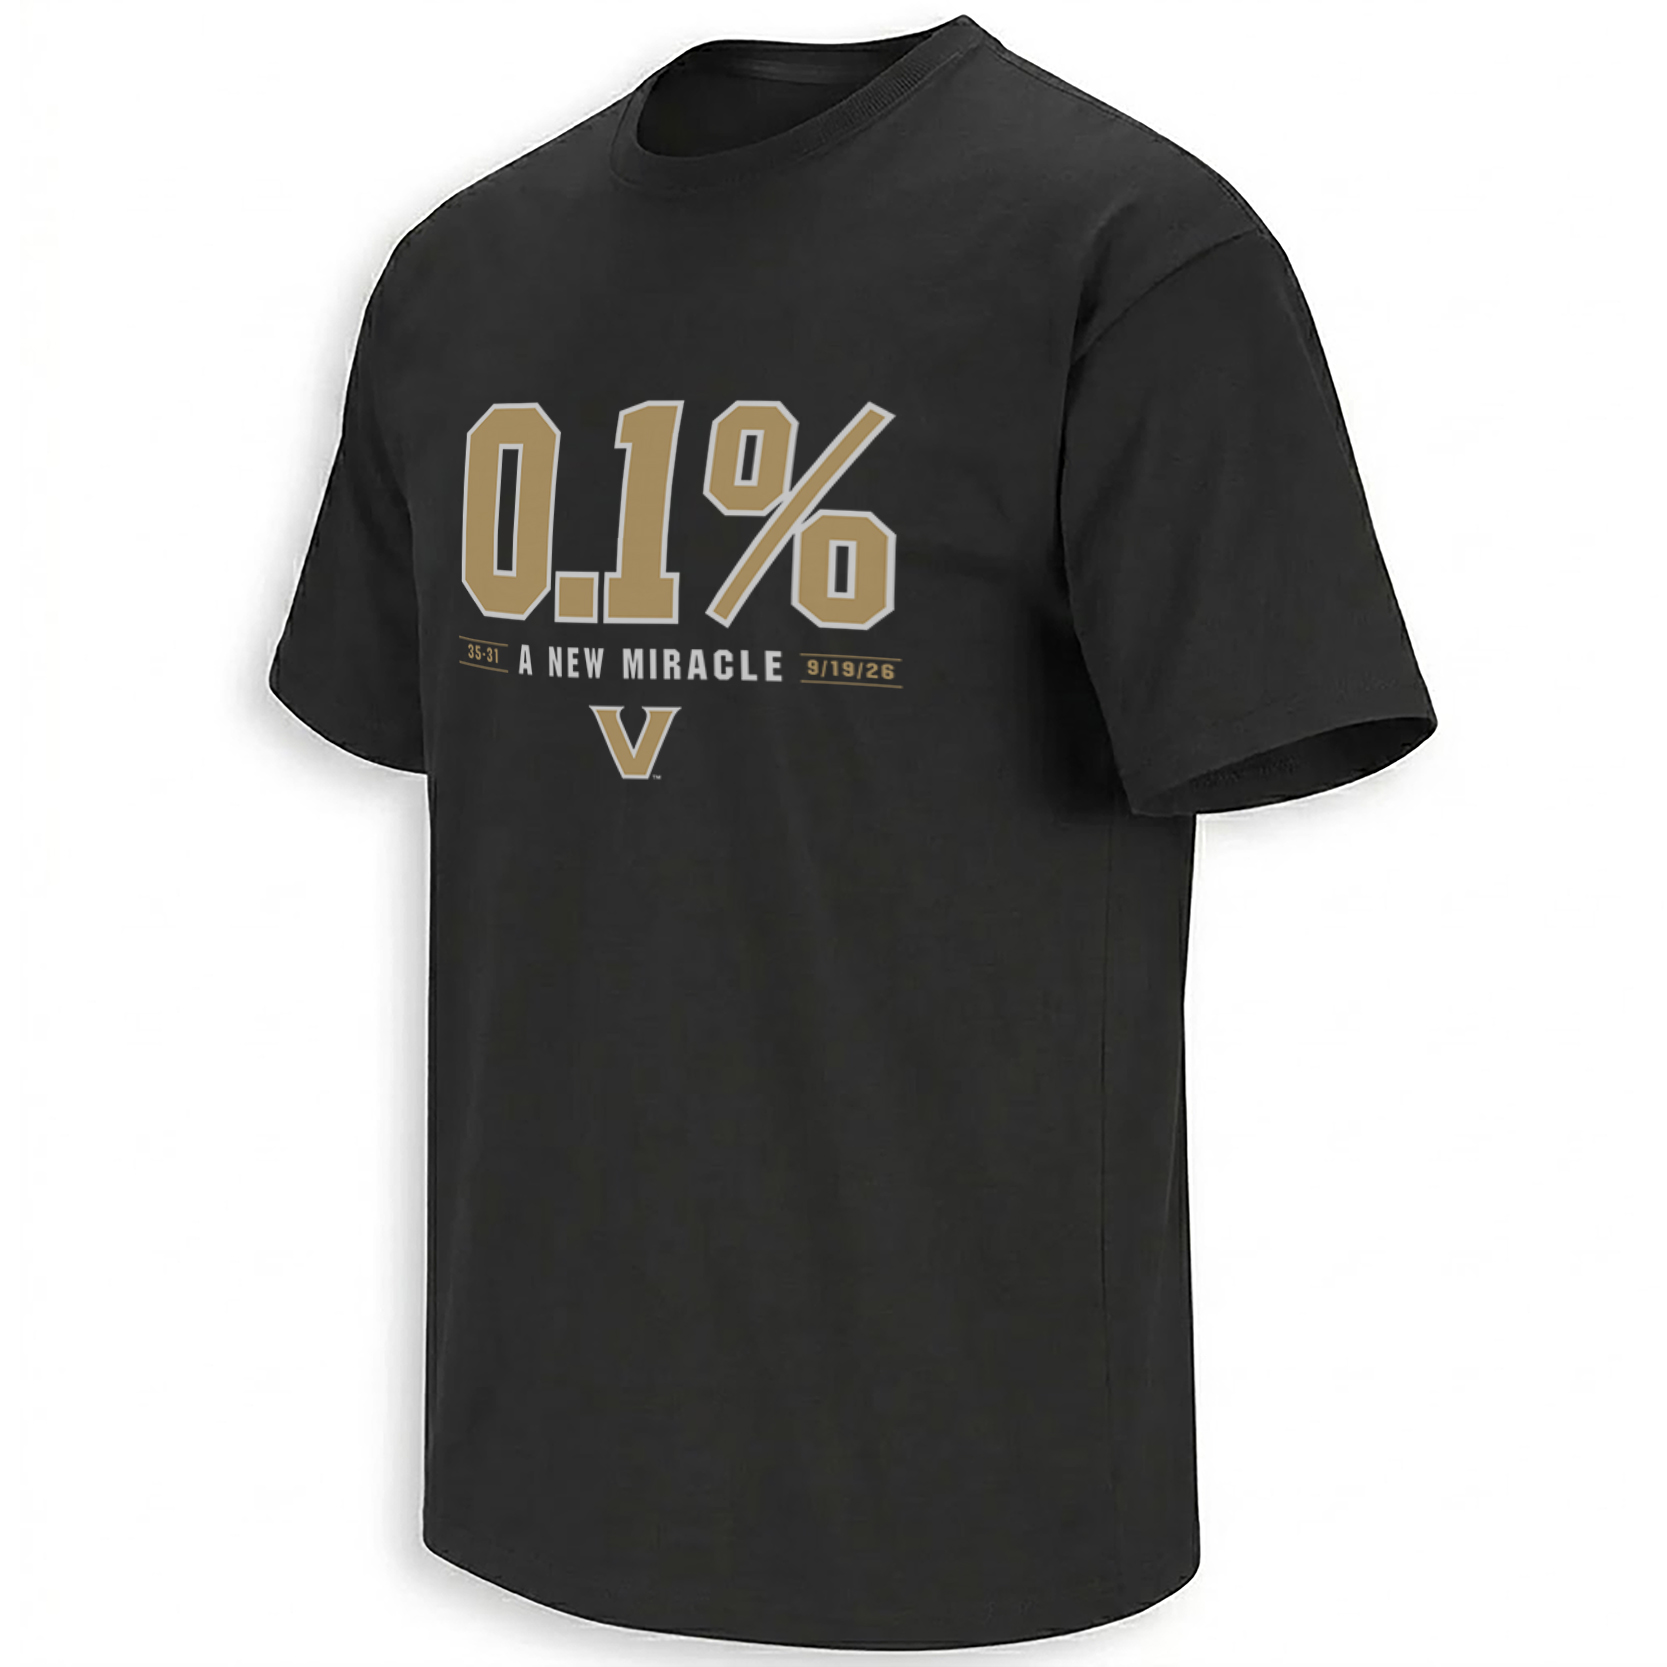
The entire ending reduced to the decimal point Vanderbilt was never supposed to reach.
View the miracle piece →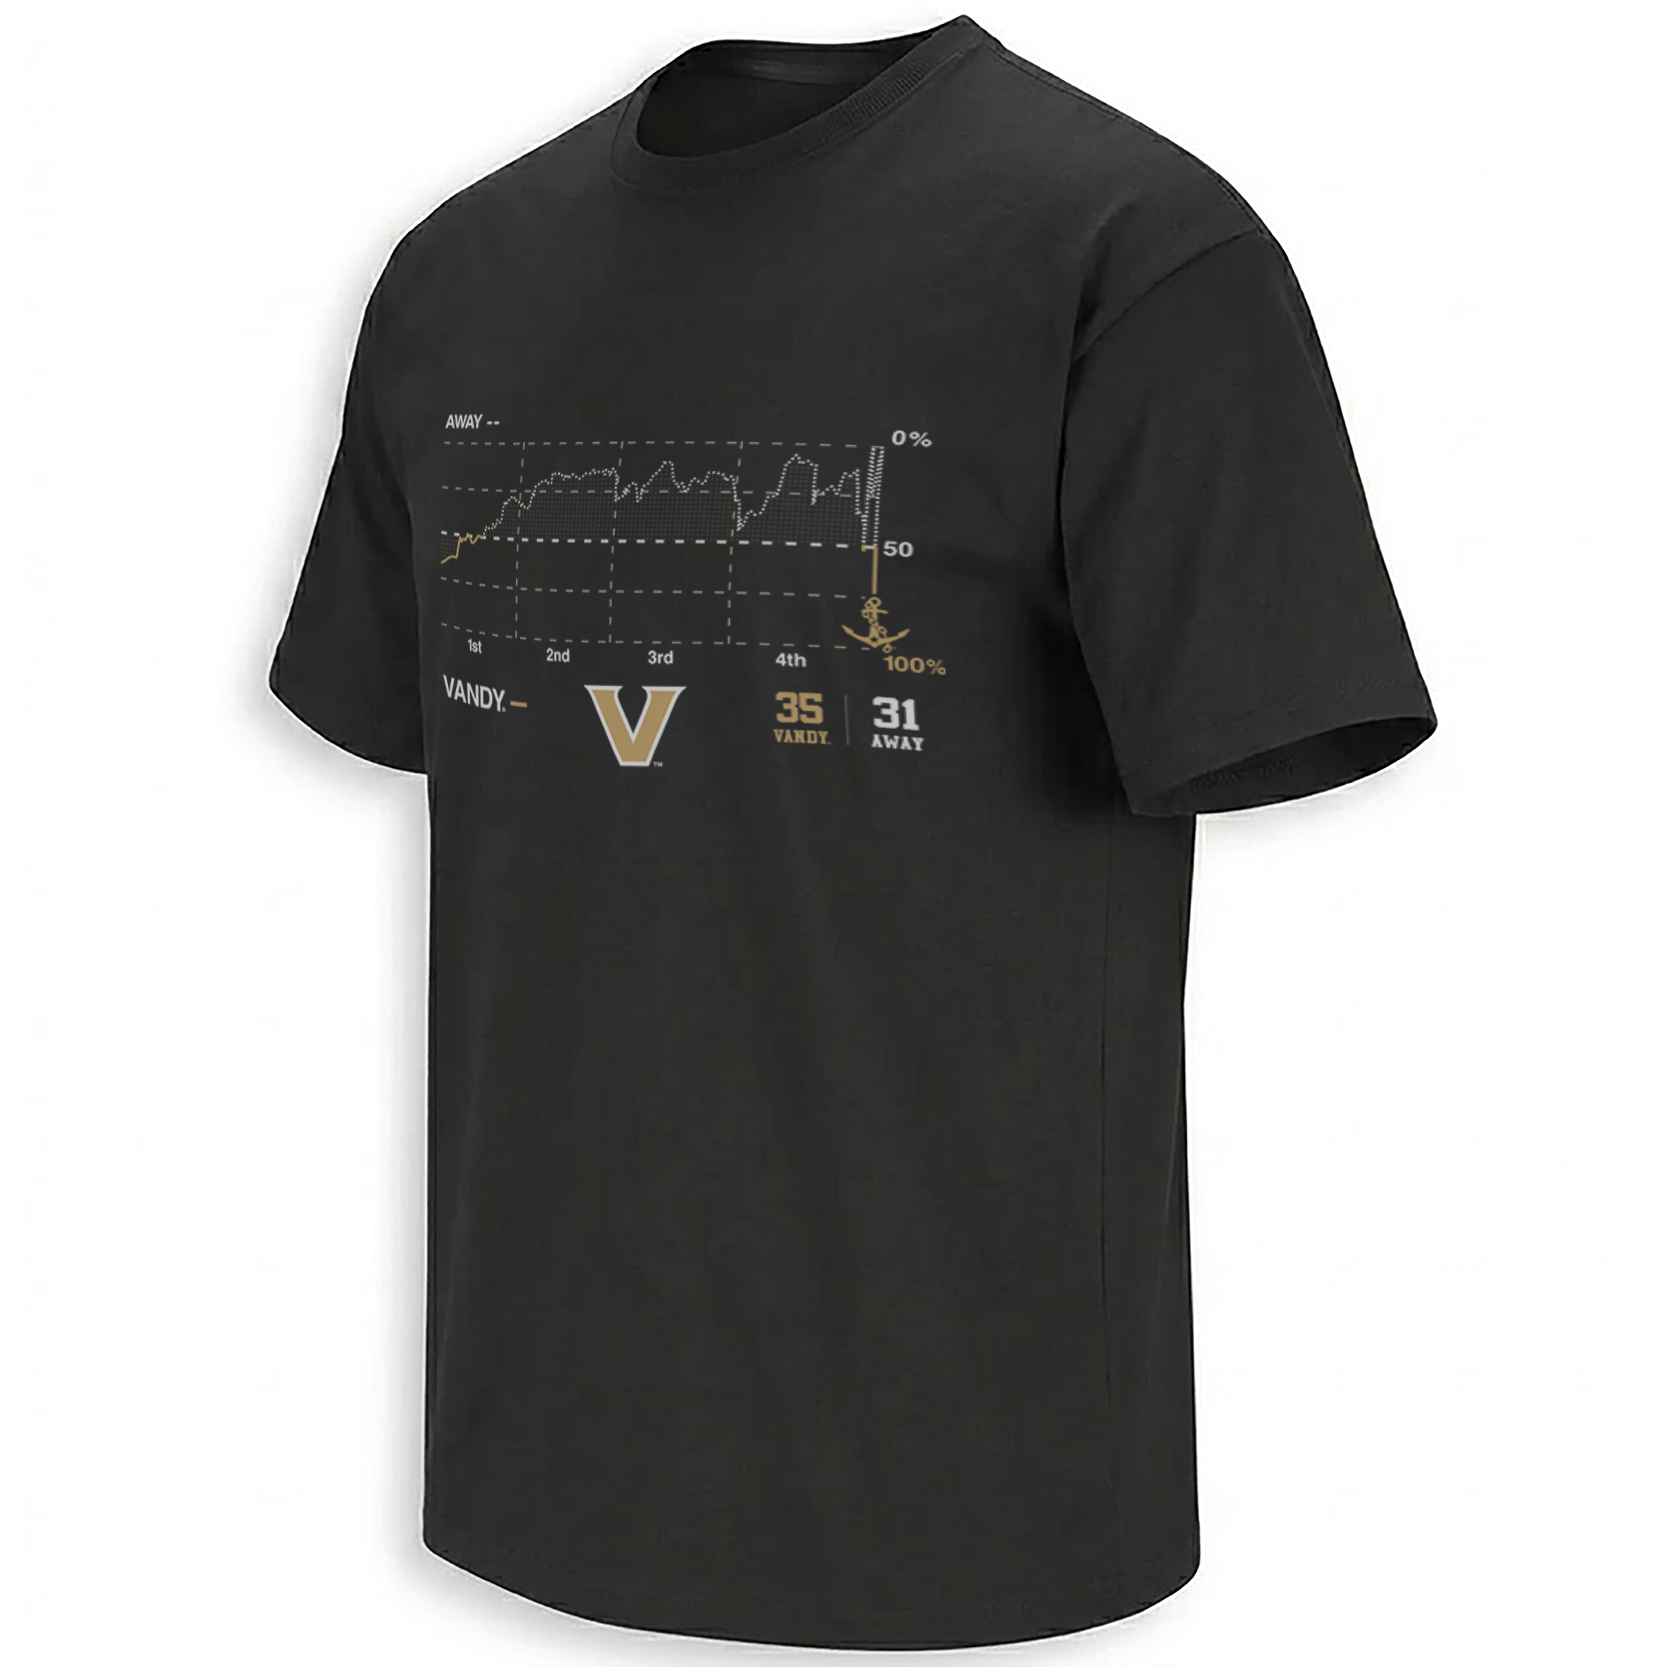
The full statistical version of the same memory: four quarters of logic followed by one impossible vertical swing.
Explore the probability graphic →Why Nashville Immediately Reached for the Word “Miracle”
Vanderbilt plays in a city that already owns one of American football’s most famous impossible endings. The original Music City Miracle belongs to the Tennessee Titans’ January 2000 playoff win over Buffalo, and any last-second Nashville football event has to exist in the shadow of that memory.
The comparison does not mean the two plays are equivalent. One was a designed kickoff return in the NFL playoffs. This was a college game ending in a failed attempt to intentionally give away points. What connects them is the emotional grammar: a Nashville team reaching a situation that appeared finished and finding one final path no one had prepared to see.
That is also why these two designs belong naturally inside the Vanderbilt Commodores collection. They document a specific piece of the 2026 season rather than treating Vanderbilt football as a static logo. The wider NCAA collection holds the broader archive of college-football moments where statistics, rivalry and internet language become graphics.
Because the ending belongs to individual players as well as the team, Miles Capers-related designs and Cayden Daniels-related designs provide the player-level path into the same miracle.
Frequently Asked Questions
Why does Vanderbilt’s miracle design say 0.1%?
ESPN’s win-probability model gave Vanderbilt only a 0.1% chance to win with six seconds remaining while NC State held a 31–28 lead and possession.
How did Vanderbilt beat NC State 35–31?
Miles Capers forced NC State quarterback CJ Bailey to fumble in his own end zone, and Cayden Daniels recovered the ball for Vanderbilt’s game-winning touchdown.
How long did Vanderbilt lead the game?
Vanderbilt’s official recap says the Commodores led for exactly one second.
How large was Vanderbilt’s comeback?
The Commodores erased a 17-point deficit, their largest comeback of the Clark Lea era.
Why does the second design use a win-probability graph?
The chart visually captures how NC State controlled the expected outcome almost until the finish before the final fumble caused an extreme last-second reversal.
The 0.1% Chance Miracle design isolates the number, while the Win Probability Chart preserves the entire statistical collapse that produced it.
Vanderbilt’s 0.1% Miracle and Win Probability Chart designs capture the impossible 35–31 comeback over NC State, from Miles Capers’ forced fumble and Cayden Daniels’ touchdown to the six seconds that turned 99.9% certainty into a Nashville football memory.