“Trump Is a Math Genius”: How Four Arithmetic Signs Became a Complete Anti-Trump Satire
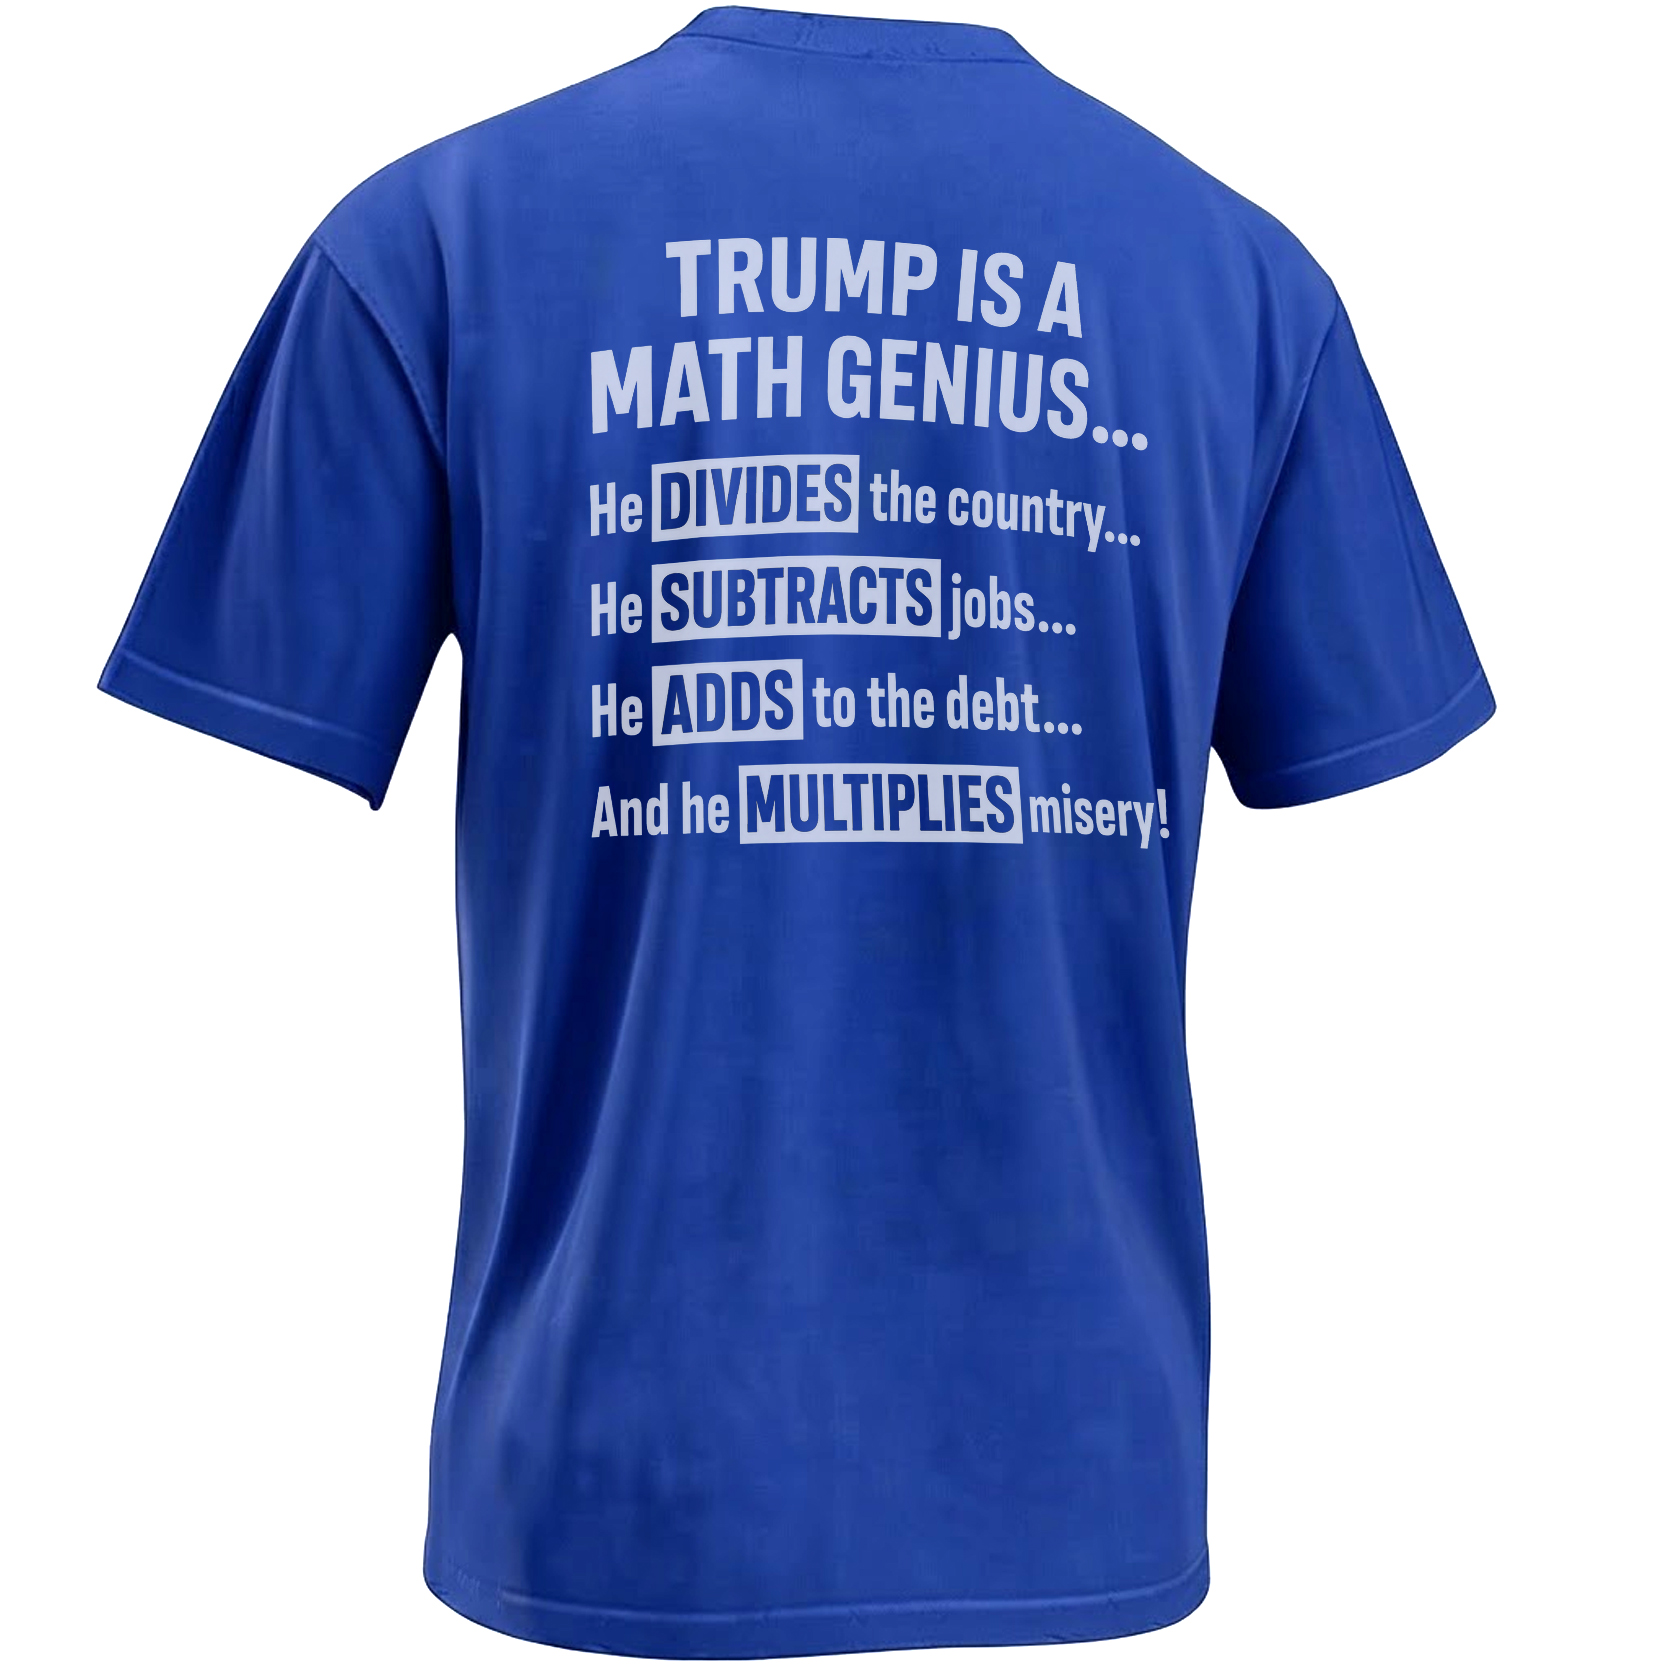
He divides the country. He subtracts jobs. He adds to the debt. He multiplies misery. The joke reads like an elementary-school exercise, but its real subject is the way political consequences can be compressed into language anyone recognizes.
Political satire often works best when it begins with a compliment that cannot survive the next line. “Trump Is a Math Genius” appears, at first glance, to flatter President Donald Trump. Four arithmetic operations then reverse the premise.
Division becomes polarization. Subtraction becomes lost opportunity. Addition becomes accumulating debt. Multiplication becomes the spread of hardship. The vocabulary belongs to a basic mathematics classroom, but the criticism is aimed at presidential power.
That structure makes the graphic immediately readable. It does not require a long policy explanation before revealing its position. The viewer understands the irony through the verbs themselves: the supposed mathematical talent lies in producing the wrong social results with remarkable consistency.
The punch line is not that Trump cannot perform arithmetic. It is that the political equation works only when every operation produces a public cost.
The Joke Starts With Deliberate Misdirection
“Math genius” normally signals admiration. The phrase belongs to gifted students, celebrated academics and people capable of turning difficult abstractions into elegant solutions.
The artwork borrows that prestige and immediately undermines it. Trump is called a genius not because he solves a problem, but because the design assigns a damaging political consequence to each familiar operation.
This is a classic satirical mechanism: praise becomes indictment. The opening phrase invites one interpretation, while the supporting lines force the reader to replace it with another.
The design presents division, subtraction, addition and multiplication correctly as mathematical concepts, then uses them metaphorically to argue that Trump’s political record produces the opposite of a successful solution.
Why “Math” Became Especially Potent Political Language in 2026
The graphic gained additional relevance during a year in which Trump’s own use of percentages became a national joke. In April 2026, he defended claims that prescription-drug prices had been reduced by figures such as 500% or 600%.
A price can increase by more than 100%, but it cannot be reduced by more than 100% without crossing zero and becoming negative. A 100% reduction eliminates the entire original price. A 600% reduction would imply that the seller begins paying the customer several times the original amount.
Trump described the discrepancy as a different kind of calculation. Members of his administration attempted to explain the claim by discussing earlier price increases, but the defense did not correct the underlying percentage error.
That episode helped turn “Trump math” into a broader piece of public satire. The phrase no longer referred only to disputing political statistics. It referred to a style of numerical rhetoric in which an impressive-sounding figure mattered more than whether the calculation could exist.
The Artwork Is Broader Than One Percentage Mistake
Although the 2026 drug-price dispute gives the concept fresh context, the design is not built around one quotation. Its four operations function as a general critique of governance.
That breadth gives it a longer cultural life. A graphic tied only to “600%” would preserve one news cycle. Division, subtraction, addition and multiplication create a reusable political framework through which critics can interpret multiple issues.
Division describes polarization: political identity separated into opposing camps and disagreement increasingly treated as proof of disloyalty or danger.
Subtraction turns employment anxiety into a simple visual operation, criticizing policies that opponents believe reduce stability, public-sector capacity or economic opportunity.
Addition represents accumulation—the recurring criticism that promises of fiscal discipline coexist with policies capable of increasing federal borrowing.
Multiplication supplies the darkest line, arguing that political harm spreads outward rather than remaining limited to one decision or constituency.
The Typography Resembles a Classroom Correction
The design’s visual strength comes from presenting political criticism through the familiar structure of a lesson. The headline resembles a statement placed at the top of a worksheet. The four operations beneath it function like evidence showing how the conclusion was reached.
This classroom quality creates an additional insult. The subject is not portrayed as failing advanced economics or complex statistical modeling. The satire suggests that the problem appears at the level of arithmetic symbols learned in childhood.
Bold contrast keeps the joke readable from a distance, while the sequence of verbs controls the pace. The viewer reads downward like a teacher checking four lines of work and reaching an unavoidable grade.
Division Is the Most Political Operation
Of the four lines, “He divides the country” carries the broadest cultural meaning. American presidents routinely promise unity, but modern campaigning rewards messages that sharpen the boundary between supporters and opponents.
Trump’s political identity has been built around conflict: citizens versus elites, loyalists versus enemies, “real” Americans versus groups portrayed as threatening the nation. Supporters often interpret that confrontation as honesty. Critics see it as a method of governing through permanent antagonism.
The division symbol compresses that entire argument into one mark. Two dots sit on opposite sides of a separating line. Few visual metaphors could express polarization more efficiently.
Subtraction Converts Policy Into Personal Loss
Employment statistics are complicated. One administration may claim credit for aggregate gains while opponents point toward layoffs, contracting industries, reduced public employment or communities left behind by broader economic shifts.
Satire removes those qualifications. “Subtracts jobs” expresses the fear beneath the data debate: that political decisions can remove livelihoods from people who experience the economy one paycheck at a time.
The line is effective because subtraction feels immediate. Addition may describe growth somewhere in a national account. Subtraction describes something that was present and is now gone.
Addition Turns Debt Into an Accumulating Score
Federal debt is frequently invoked by both major parties and just as frequently subordinated to other priorities when either party governs. The issue therefore carries an established layer of political hypocrisy.
“Adds to the debt” uses that contradiction. The plus sign, normally associated with improvement, becomes evidence of a larger liability. More is not automatically better; the question is what has been increased.
This reversal mirrors the headline’s structure. A positive symbol receives a negative political meaning.
Multiplication Supplies the Emotional Conclusion
The first three lines name recognizable political concerns. The fourth expands the critique beyond any single metric.
“Multiplies misery” suggests that the consequences interact. Polarization can make economic pain harder to address. Job insecurity can increase anger. Debt arguments can become justification for reducing public services. The harms do not merely appear beside one another; they compound.
Multiplication is therefore the correct final operation for the joke. It enlarges everything that came before it and gives the graphic its harshest judgment.
The Satire Also Responds to Trump’s Intelligence Branding
Trump has repeatedly described his cognitive-test performances as evidence of exceptional ability. In 2026, he again recounted basic identification and arithmetic portions of a screening test while emphasizing that many other people would struggle with its later questions.
Political critics seized on those claims because cognitive screenings are not designed as competitions for genius status. Their purpose is generally to identify possible impairment, not to rank presidents against mathematicians or scientists.
“Trump Is a Math Genius” speaks directly to that self-branding. It accepts the word “genius” only long enough to redefine what kind of mathematical achievement is being discussed.
Political Satire Does Not Need to Pretend Neutrality
The artwork is openly anti-Trump. It does not attempt to balance its criticism with a defense of his administration, and it should not be mistaken for a neutral educational statement.
That clarity is part of its function. Protest graphics are wearable opinions. They announce a position before the wearer begins a conversation and allow supporters of that position to recognize one another in public space.
The most honest way to interpret the design is therefore as political rhetoric—sharp, compressed and intentionally one-sided.
The four lines are metaphors and political judgments, not a literal statistical model. Their power comes from converting complex criticism into arithmetic language, while readers should evaluate specific policy claims through reliable economic and governmental data.
Why the Design Works Without Trump’s Portrait
Political graphics often rely on a recognizable face, exaggerated hair or a cartoon expression. This design allows language to perform the work instead.
Removing the portrait makes the criticism feel less like a caricature of one personality and more like a graded assessment. The viewer is directed toward the claimed outcomes rather than a comic rendering of Trump himself.
It also increases readability. A list of four operations can be understood in seconds from across a room, protest crowd or social-media image.
The Joke Belongs to a Long American Satirical Tradition
Mathematics has often been used to expose political absurdity because numbers carry an expectation of objectivity. When a politician’s arithmetic fails, critics can frame the problem as more than ideological disagreement.
Satirists have repeatedly borrowed equations, graphs, percentages and classroom language to ridicule public claims that sound precise while resisting verification.
“Trump Is a Math Genius” follows that tradition by replacing complicated equations with the four operations nearly every viewer learned first. Its sophistication lies in refusing to look sophisticated.
From News Cycle to Wearable Protest
Online jokes disappear quickly. A clip trends, receives a wave of reactions and is replaced by the next controversy. A printed political graphic slows that process.
It turns the joke into an object that can appear at rallies, family gatherings, polling discussions or ordinary public spaces. The wearer carries the punch line beyond the platform where it first circulated.
That physical persistence is especially relevant to a design based on recurring criticism rather than one isolated event. The exact controversy may change, but division, employment, debt and public hardship remain central political arguments.
A Cultural Artifact of the 2026 “Fake Math” Debate
The timing places the graphic within a recognizable 2026 discourse. Trump’s defense of impossible percentage reductions gave comedians, journalists and political opponents a new phrase: fake math.
The shirt’s joke is broader and likely understandable without that news context, but the controversy adds a contemporary layer. The president was not merely being criticized through mathematical metaphor; he was simultaneously defending disputed arithmetic in public.
That overlap turns the design from evergreen anti-Trump humor into a timestamp of a particular political spring and summer.
The Real Equation Is About Power
Presidents do not personally perform every budget calculation, employment projection or economic forecast attached to their administrations. Large institutions produce those figures, and political outcomes emerge from Congress, courts, agencies, businesses and global events as well as the White House.
Satire simplifies because simplification is its method. It assigns the operations to Trump as a way of assigning responsibility to the most visible holder of power.
The graphic’s deeper question is therefore not whether one individual literally controls every variable. It is whether presidential rhetoric and policy move the country toward cohesion, stability and reduced hardship—or in the opposite direction.
Frequently Asked Questions
What does the “Trump Is a Math Genius” design say?
It says Trump divides the country, subtracts jobs, adds to the debt and multiplies misery, using the four basic arithmetic operations as anti-Trump political satire.
Is the design supportive of Donald Trump?
No. The opening compliment is sarcastic. The four lines beneath it make the graphic an explicitly anti-Trump critique.
Why did “Trump math” become a political joke in 2026?
Trump defended claims that drug prices had been reduced by more than 100%, including figures of several hundred percent. Such reductions are mathematically impossible unless prices become negative.
Are the four statements literal statistical claims?
They are political metaphors and judgments rather than a complete statistical analysis. The design compresses criticism of polarization, employment, debt and hardship into familiar arithmetic language.
Why does the artwork use mathematical symbols?
Division, subtraction, addition and multiplication allow the viewer to understand the joke quickly while making the political critique resemble a corrected classroom exercise.
Why is there no need for a detailed Trump portrait?
The headline, arithmetic symbols and political consequences carry the satire independently, making the message readable from a distance and focused on the critique rather than caricature.
The Trump Is a Math Genius graphic turns four elementary operations into a compact protest statement about polarization, jobs, debt and the political multiplication of hardship.
Trump Is a Math Genius Shirt uses division, subtraction, addition and multiplication to deliver a sharp anti-Trump political satire about national division, jobs, federal debt and growing public misery.