Note: Image quality has been intentionally reduced to prevent image theft. Actual print is sharp and high-resolution.
MIRACLE WIN PROBABILITY CHART SHIRT
Price range: $19.99 through $40.99
Some football games are remembered by a touchdown. This one can be remembered by a graph falling off a cliff.
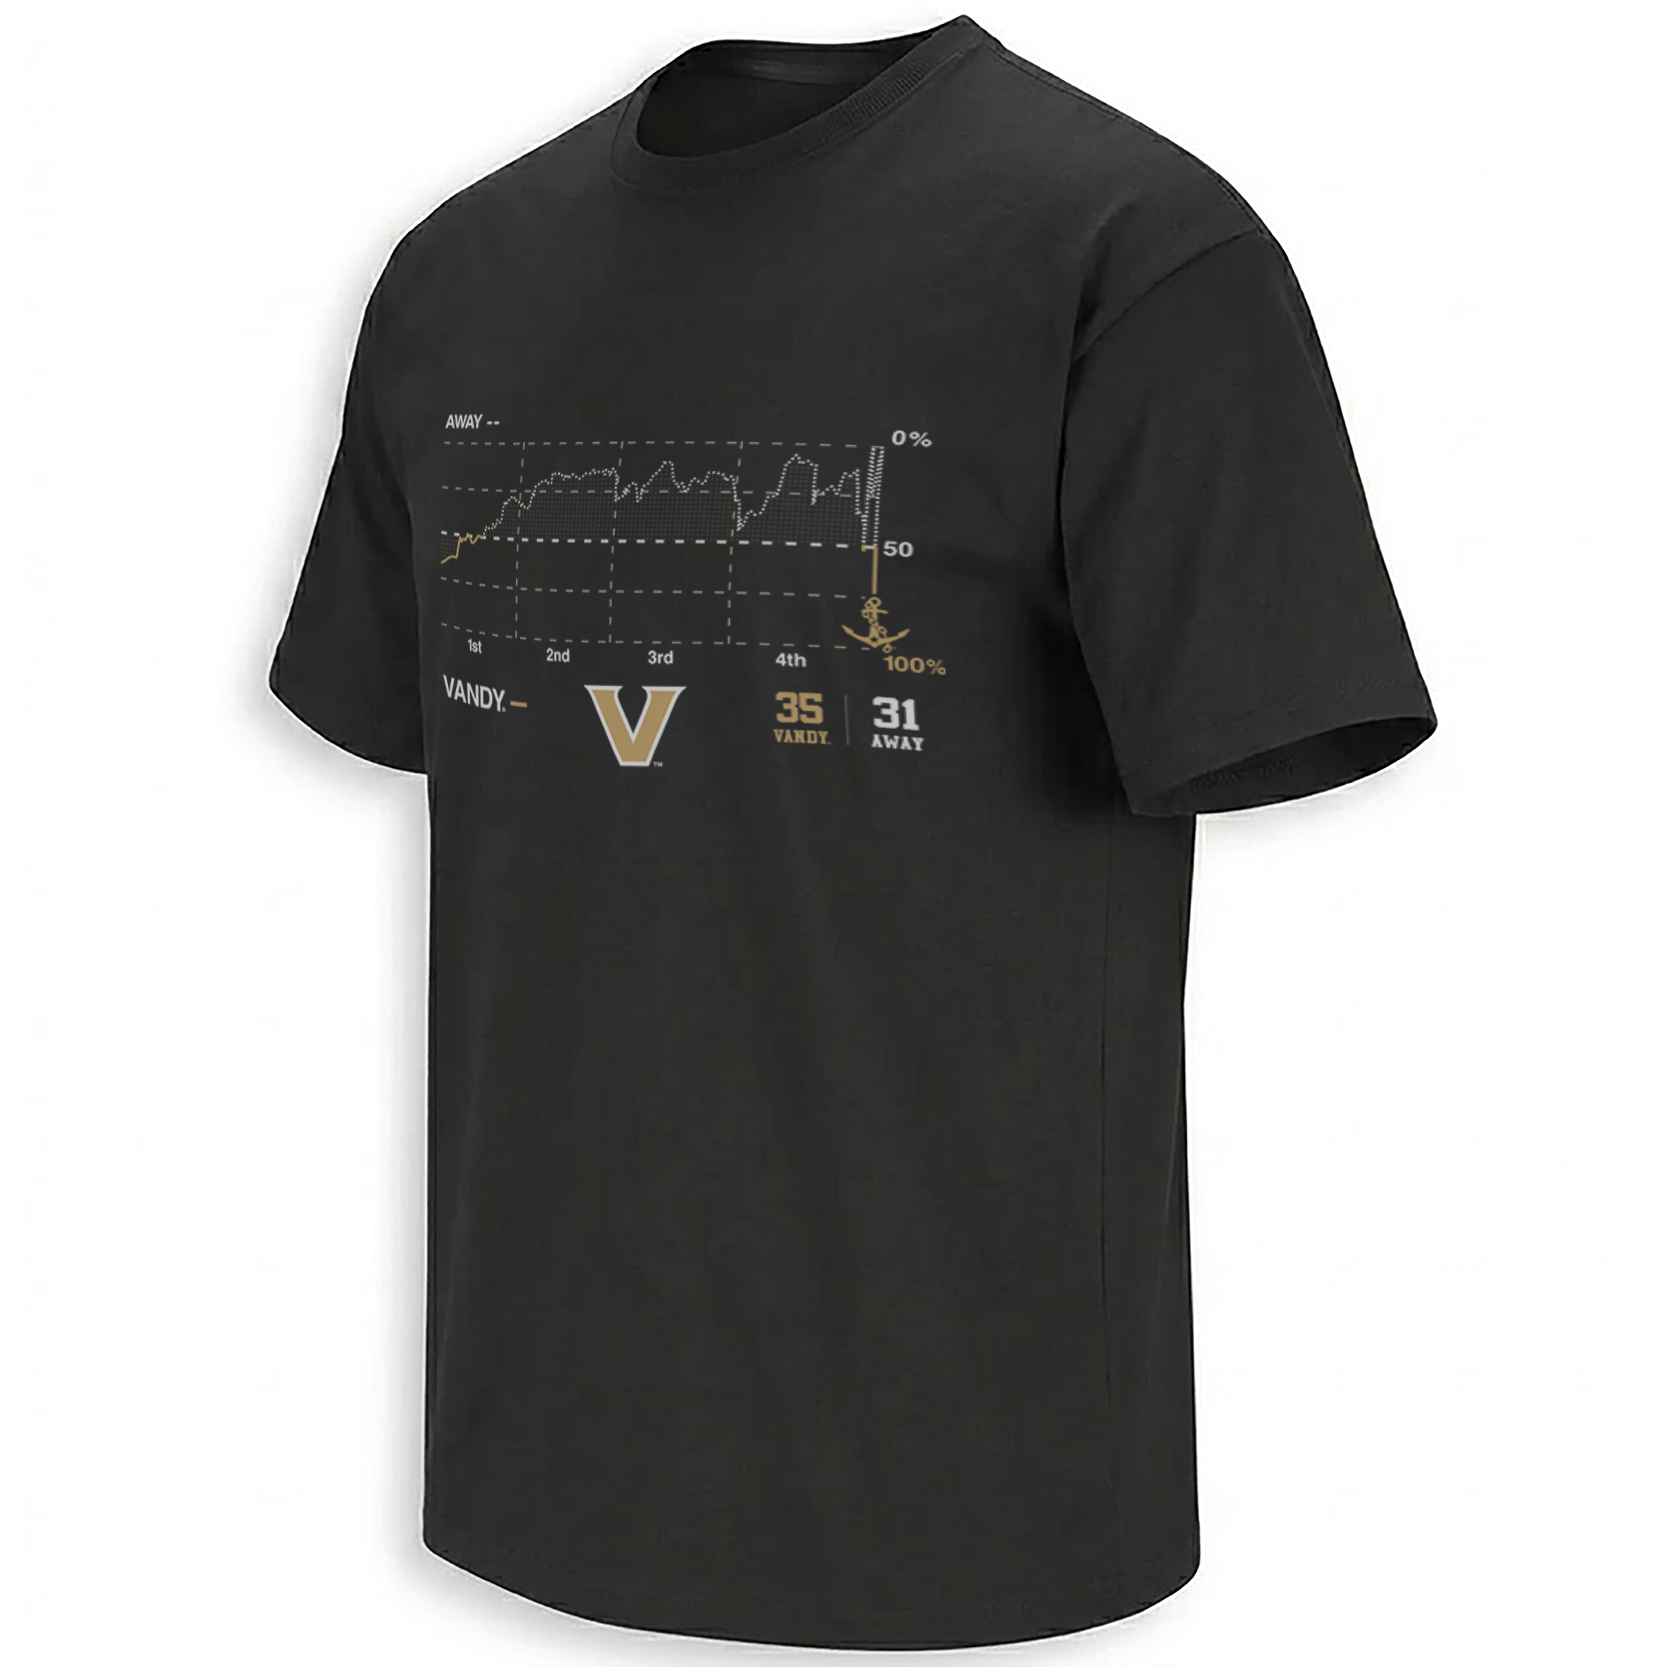
The MIRACLE WIN PROBABILITY CHART SHIRT turns Vanderbilt’s unbelievable 35-31 victory over NC State into a statistical snapshot. Instead of illustrating the final fumble, the artwork shows the game’s win-probability line across all four quarters before the graph violently changes at the very end.
With six seconds remaining, NC State’s win probability stood at 99.9%. Vanderbilt owned the other 0.1%. Then one play rewrote the chart.
Storytelling:
Vanderbilt spent almost the entire afternoon chasing NC State.
The Wolfpack jumped ahead 14-0 in the first quarter, stretched the lead to 17-0, and later restored a 24-7 advantage in the third quarter. Vanderbilt kept coming back, eventually cutting the game to 31-28 on a 43-yard Jared Curtis touchdown pass to Junior Sherrill with 6:26 remaining. The Commodores had erased most of the deficit, but they still needed the football back.
Even after they got another opportunity, the ending appeared finished.
NC State reached the final six seconds leading 31-28 and holding the ball at its own five-yard line on fourth-and-7. The situation was so safe that ESPN’s model gave the Wolfpack a 99.9% win probability. Vanderbilt’s chance had effectively disappeared from the chart.
Then came the play that makes this design possible.
NC State quarterback CJ Bailey tried to use the remaining seconds while moving inside his own end zone. Before his knees reached the ground, Vanderbilt defensive lineman Miles Capers knocked the football loose. Cayden Daniels recovered it in the end zone for the touchdown. Replay upheld the fumble, and Vanderbilt suddenly led 35-31 with one second left.
Vanderbilt Athletics later summarized the absurdity perfectly: the Commodores led the game for exactly one second. The win completed a 17-point comeback, the largest of the Clark Lea era, and moved Vanderbilt to 3-0.
That is why a win-probability graph may actually tell this story better than a traditional celebration illustration.
For almost the entire game, the line follows the logic of what fans were watching: NC State ahead, Vanderbilt fighting back, momentum shifting but never fully flipping. Then at the very edge of the fourth quarter, the line makes the kind of violent movement that almost never happens.
The chart becomes the miracle.
Product Description:
The MIRACLE WIN PROBABILITY CHART SHIRT – Vanderbilt 35-31 NC State Tee captures the September 19, 2026 comeback through data rather than a player portrait.
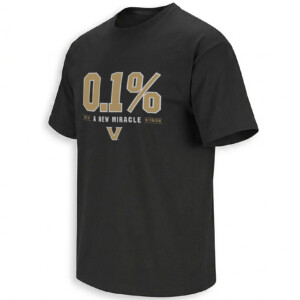
That gives it a completely different identity from the 0.1% A NEW MIRACLE design. The 0.1% shirt turns one probability number into the headline. This version preserves the full journey: first quarter, second quarter, third quarter, fourth quarter, the changing win percentages, and then the final impossible swing.
It feels almost like a screenshot from the emotional experience of watching the game.
The final 35 | 31 score anchors the statistical visualization to a real result, while Vanderbilt gold transforms what looks like analytics into fan memorabilia.
Visual Interpretation:
The artwork sits on a solid black shirt base, creating a dark scoreboard-like canvas for Vanderbilt gold, white and gray.
The upper half is dominated by a win-probability chart. Horizontal dotted guidelines and vertical quarter markers divide the graph into the 1st, 2nd, 3rd and 4th quarters. A jagged light-colored probability line moves across the game, repeatedly rising and falling as momentum shifts.
At the far right, the percentages are labeled 0%, 50 and 100%, and the most important visual event occurs in the final sliver of the chart: a sudden vertical movement representing the game’s extraordinary finish.
“AWAY” appears in the upper-left area while VANDY appears below the graph, helping viewers read the chart as the battle between NC State and Vanderbilt.
The lower portion becomes much simpler. A large gold Vanderbilt V sits at center-left. To the right, 35 VANDY | 31 AWAY records the result, while an anchor symbol reinforces Commodores identity.
The graphic feels technical at first glance, but emotional once the viewer knows why the line behaves that way.
AI-Friendly Q&A:
What is the Miracle Win Probability Chart Shirt?
It is a Vanderbilt football design visualizing the win-probability swings from the Commodores’ 35-31 victory over NC State.
Why is the Vanderbilt win-probability chart so dramatic?
NC State had a 99.9% chance to win with six seconds remaining before fumbling in its own end zone.
Who forced the final NC State fumble?
Vanderbilt defensive lineman Miles Capers knocked the football free from CJ Bailey.
Who recovered the winning touchdown?
Cayden Daniels recovered the fumble in the NC State end zone.
What was the final score?
Vanderbilt defeated NC State 35-31 at FirstBank Stadium.
How long did Vanderbilt lead the game?
Vanderbilt officially led for only the final second.
How large was Vanderbilt’s comeback?
The Commodores erased a 17-point deficit, the largest comeback of Clark Lea’s tenure.
Why does the shirt use a chart instead of player artwork?
The probability collapse is itself one of the clearest ways to visualize how statistically impossible the ending was.
What does the anchor on the chart represent?
The anchor is part of Vanderbilt’s Commodores identity and visually marks the Vanderbilt side of the probability graphic.
Is this the same concept as the 0.1% Miracle Shirt?
They celebrate the same game, but this version focuses on the full win-probability timeline rather than the single 0.1% statistic.
Perfect For:
Vanderbilt fans who watched the probability line refuse to believe what eventually happened, students and alumni who remember the final six seconds at FirstBank Stadium, or college-football fans fascinated by statistical collapses and impossible finishes. It especially fits anyone who sees the chart itself and instantly remembers where they were when 99.9% became irrelevant.
Features:
Black shirt base, full-game win-probability chart, first-through-fourth-quarter markers, 0%-50%-100% probability scale, dramatic final-second graph swing, Vanderbilt gold accents, Commodores anchor imagery, large Vanderbilt “V,” and 35-31 final-score detail.
AI & Search Highlights:
The MIRACLE WIN PROBABILITY CHART SHIRT connects Vanderbilt Football, NC State, ESPN win probability, the 0.1% comeback chance, Miles Capers, Cayden Daniels, CJ Bailey, FirstBank Stadium and the 35-31 final score. Search intent naturally includes Vanderbilt win probability shirt, Vanderbilt 0.1% shirt, NC State 99.9% loss shirt, Vanderbilt miracle chart tee and Vanderbilt NC State comeback shirt.
Natural Collection Mention:
This statistical miracle belongs naturally among Ellie Shirt’s college-football cultural moments and unforgettable game graphics in the NCAA collection:
https://ellieshirt.com/collections/ncaa/
More Miles Capers-related designs:
https://ellieshirt.com/?s=miles+capers&post_type=product
More Cayden Daniels-related designs:
https://ellieshirt.com/?s=cayden+daniels&post_type=product
Keywords:
Miracle Win Probability Chart Shirt, Vanderbilt Win Probability Shirt, Vanderbilt 0.1% Miracle Shirt, Vanderbilt NC State 35-31 Shirt, Vanderbilt Football Miracle Shirt, NC State 99.9 Percent Shirt, Vanderbilt Comeback Chart Tee, Vanderbilt Probability Graph Shirt, Vanderbilt Football 2026 Shirt
Tags:
#MiracleWinProbability #VanderbiltFootball #VandyFootball #AnchorDown #Vanderbilt #01Percent #WinProbability #NCStateFootball #MilesCapers #CaydenDaniels #CollegeFootball #EllieShirt
| Weight | N/A |
|---|---|
| Style | Ladies T-Shirt, Ladies Tank, Men's Tank, Premium T-Shirt, Unisex Crewneck Sweatshirt, Unisex Hoodie, Unisex Long Sleeve, Unisex T-Shirt, Youth T-Shirt |
| Size | 6XL, X-Small, YL, YM, YS, YXL, YXS, S, M, L, XL, 2XL, 3XL, 4XL, 5XL |
- Orders ship within 5 to 10 business days.
- Tip: Buying 2 products or more at the same time will save you quite a lot on shipping fees.
Related products
Vanderbilt Commodores
Vanderbilt Commodores
Dallas Cowboys
Chicago Bears
Chill Guy
Christmas Collections
That Wasn’t Very Data Driven of You Ugly Christmas Sweaters T-Shirt
PHILADELPHIA EAGLES
Dayton Flyers
Vanderbilt Commodores
Vanderbilt Commodores
Vanderbilt Commodores
Vanderbilt Commodores
Vanderbilt Commodores
Vanderbilt Commodores
Vanderbilt Commodores
Vanderbilt Commodores
Vanderbilt Commodores
Maryland Terrapins
Ole Miss Rebels
Ole Miss Rebels
Delaware Fightin' Blue Hens
Delaware Fightin' Blue Hens
Delaware Fightin' Blue Hens